Building a Power BI report on one spreadsheet is easy. Most real questions need more than one, though. Your orders are in one file, your customer list is in another, and you want to see what each type of customer buys.
The way to answer that is to combine tables in Power BI with a relationship. In this post I'll load two CSV files into Power BI Desktop, connect them with a relationship and build a report where clicking one visual filters the other. If you haven't built a report yet, start with how to get started with Power BI.
Three ways to combine data in Power BI
"Combine" means different things in Power BI, and picking the wrong one is an easy way to end up with a messy model.
- Relationship: The tables stay separate and Power BI links them on a shared column, like CustomerID. Use this when the tables describe different things, such as orders and customers. It's what the rest of this post covers.
- Merge queries: Power Query joins the columns of one table onto another, a lot like a VLOOKUP in Excel. You end up with one wider table.
- Append queries: Power Query stacks tables that have the same columns, like twelve monthly sales files. To pull in a whole folder of files at once, use Get data > Folder.
Start with relationships. They keep each table simple, and they're how Power BI expects a model to be built. Merging everything into one giant table works on small data but gets harder to manage, and slower, as it grows.
The example data
For this example I used sample data from Northwind Kitchenware, a demo company I use for testing. I asked Claude to generate a set of sales data for it, and I'm using two of the files: sales order lines (one row for each product on each order) and customers (one row per customer, including their segment, like independent cafe or corporate office). Both files have a CustomerID column, and that's what connects them.
Step 1: Load both files into Power BI Desktop
Open Power BI Desktop, click "Get data" on the Home ribbon and choose "Text/CSV." The file picker only takes one file at a time, so you'll do this twice: pick the first file, load it, then go back to Get data for the second.
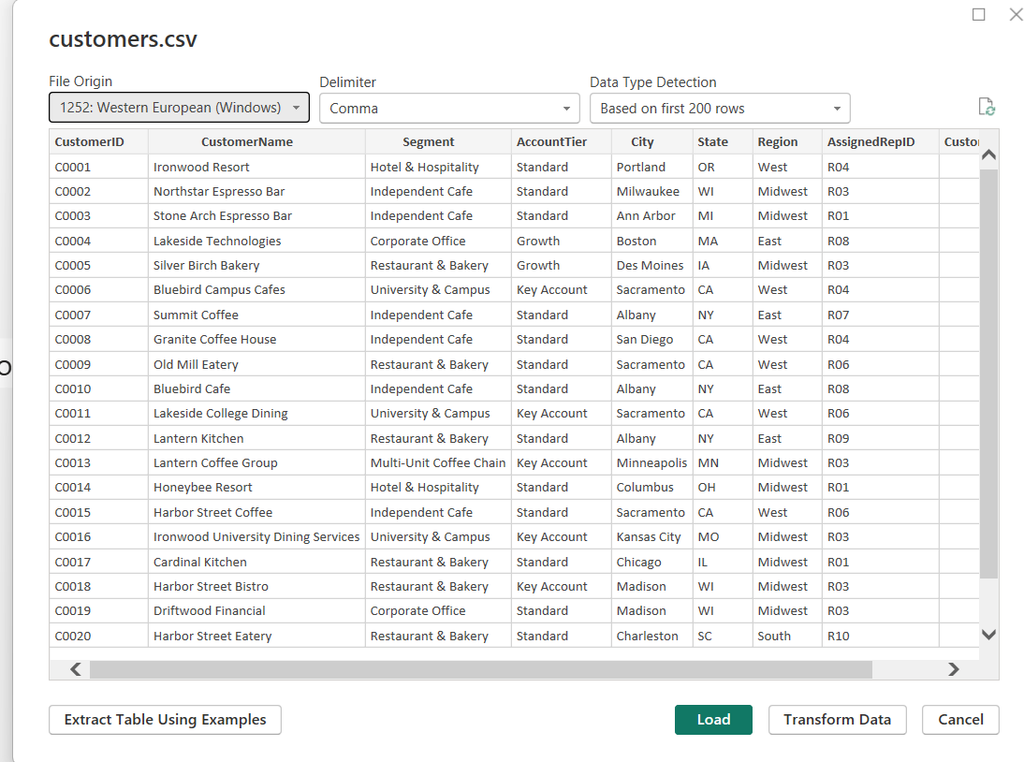
For each file, a preview window shows the data the way it will come in. If the columns look right, click "Load." If they need cleanup first, click "Transform Data" to open Power Query.
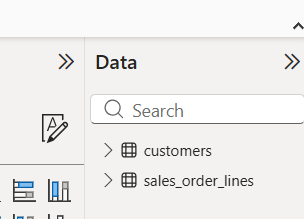
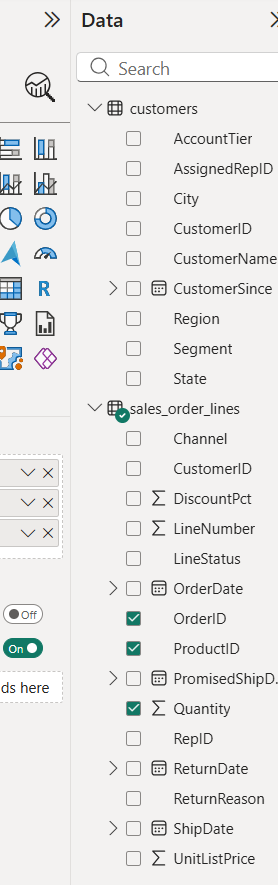
Once both are loaded, they show up as two tables in the Data pane.
Step 2: Check the relationship Power BI created
When you load more than one table, Power BI tries to link them on its own by looking for columns with the same name and data type. Sometimes it gets it right. Sometimes it links the wrong columns or doesn't link anything, so always check.
Go to the Modeling tab and click "Manage relationships." The window lists every relationship in the model, including any Power BI created for you. Claude built my sample data to be used in a data model, so both files had a clean CustomerID column and Power BI found the link on its own: sales_order_lines (CustomerID) to customers (CustomerID), marked Active.
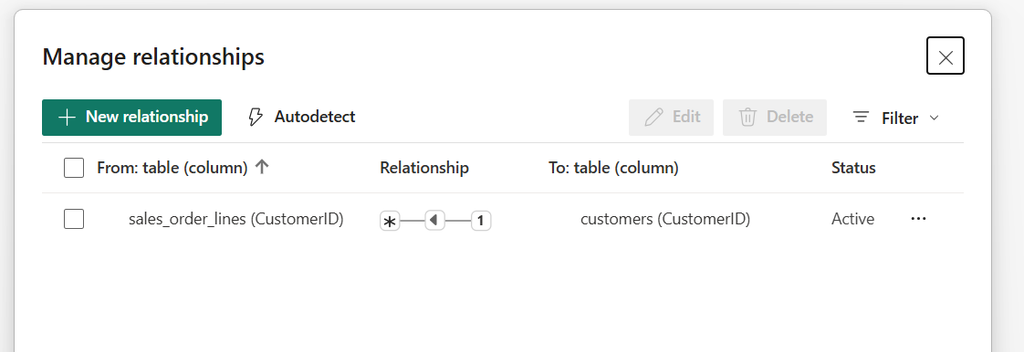
If nothing shows up, click "New relationship" and pick the two tables and columns yourself. You can also switch to Model view on the left side of Desktop and drag a column from one table onto the matching column in the other.
Step 3: Edit the relationship if it's wrong
If Power BI matched the wrong columns, click the three dots to the right of the relationship and choose "Edit." The Edit relationship window shows a preview of both tables, and you click the column you want to match in each one.
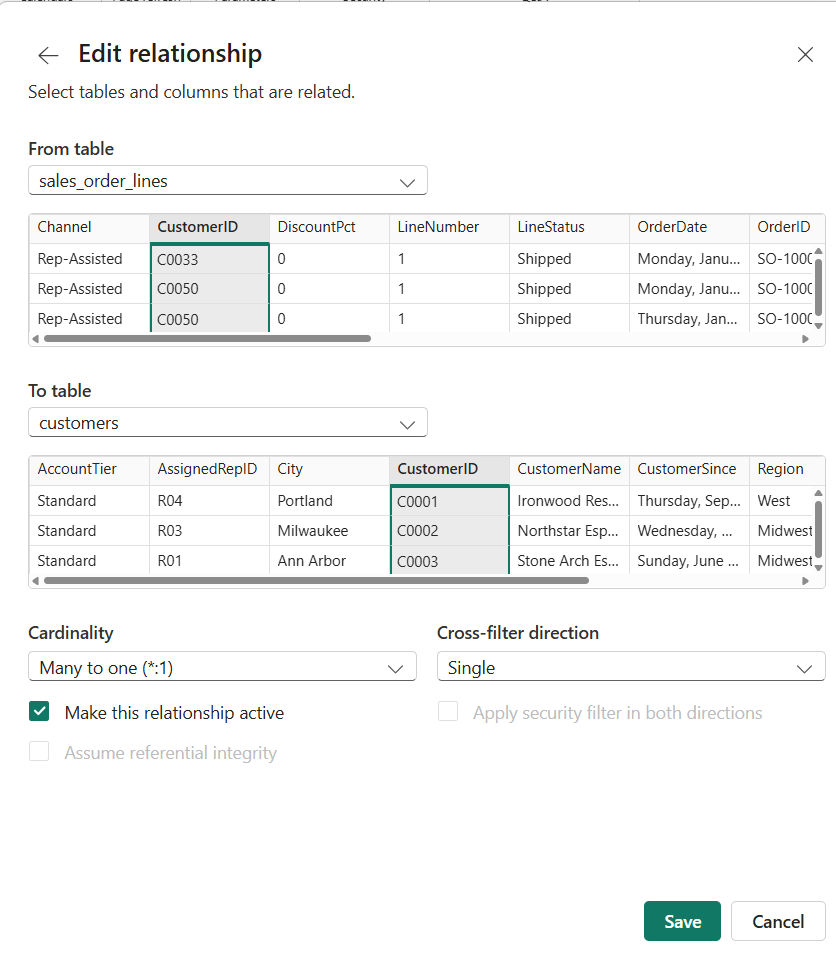
Three settings on this screen matter:
- Cardinality: How rows match up. Many to one (*:1) fits here, because one customer has many order lines and each order line belongs to one customer.
- Cross-filter direction: Which way filters flow. With Single, picking a segment in the customers table filters sales_order_lines, but not the other way around. Leave it on Single unless you have a specific reason to change it.
- Make this relationship active: This box has to be checked, or the relationship does nothing in your visuals. Two tables can only have one active relationship between them at a time.
I'll cover cardinality and cross-filter direction in more depth in a later post.
Step 4: Build visuals that filter each other
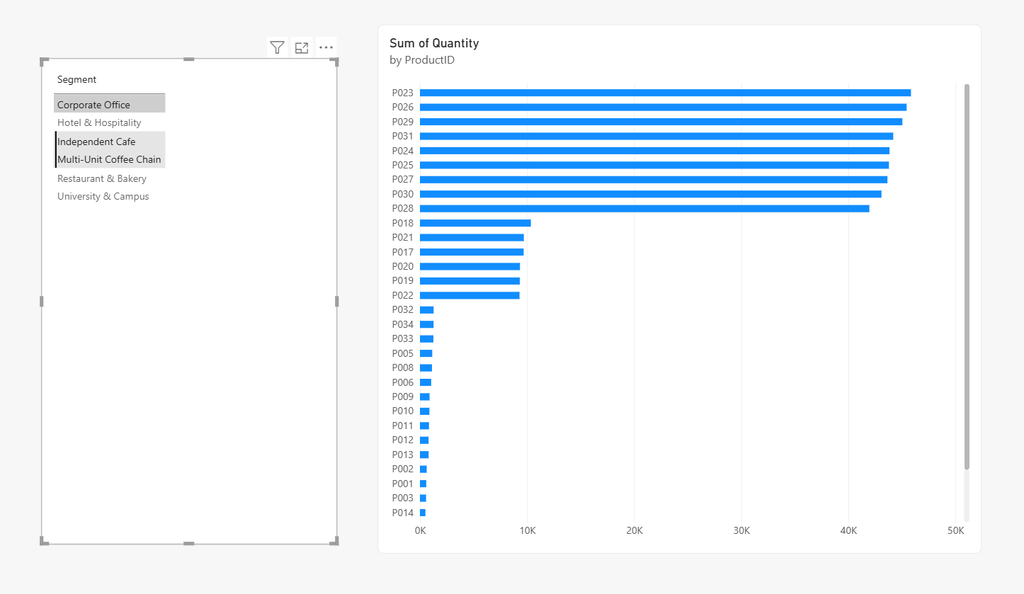
To see the relationship working, I wanted to look at the quantity ordered of each product by customer segment. Segment lives in the customers table. ProductID and Quantity live in sales_order_lines. I added a Segment visual on the left and a bar chart of Sum of Quantity by ProductID on the right.
With the relationship turned off, the two tables don't know about each other. Selecting segments on the left does nothing to the bar chart. It keeps showing totals for every customer.
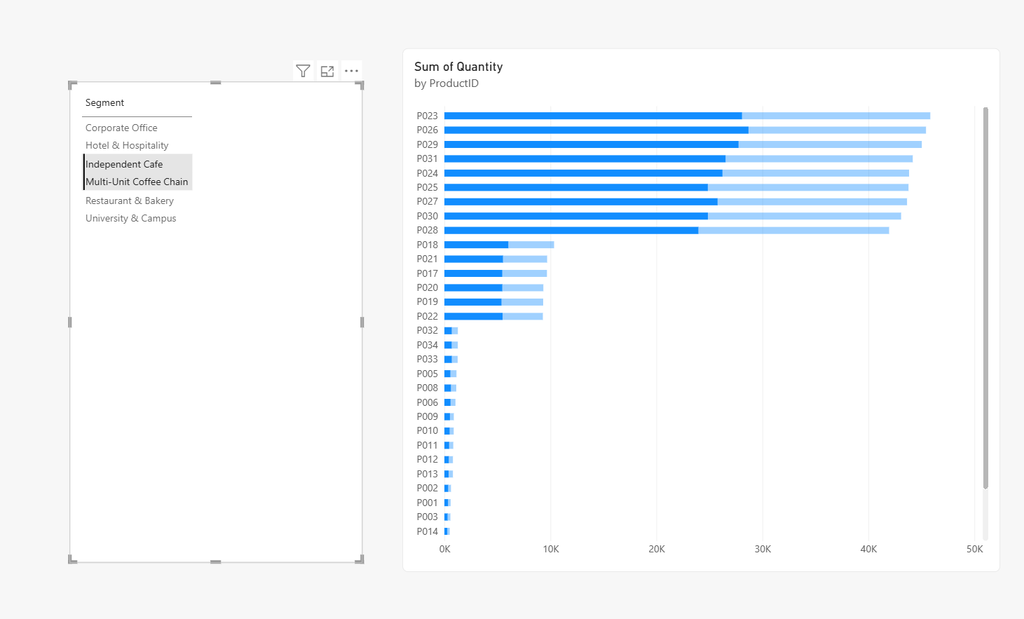
Turn the relationship back on and the visuals connect. Click a segment, or Ctrl+click to pick several, and the bar chart highlights the part of each bar that belongs to those customers. In the screenshot below I selected Independent Cafe and Multi-Unit Coffee Chain, and the darker part of each bar is what those two segments ordered.
If you'd rather the bar chart show only the selected segments instead of highlighting them, select the Segment visual, click "Edit interactions" on the Format tab, then click the filter icon above the bar chart.
Where to go from here
Adding a third table, like products or sales reps, works the same way. Most business reports end up with one table of transactions in the middle and a few lookup tables around it. If no single column identifies a row, like a product stocked in several warehouses, see how to build a Power BI relationship on multiple columns. As the model grows you'll start writing DAX measures, and the way the tables are built starts to affect speed. If a report gets sluggish, why your Power BI report loads slowly walks through the usual causes, and read DirectQuery vs Import before you connect to a database instead of files.
One more thing before you publish: if your CSV files live on your own computer, scheduled refresh in the Power BI service will need an on-premises data gateway. Loading the files from OneDrive or SharePoint avoids that. If a refresh does break, start with Power BI scheduled refresh failed: 7 causes.
Need help with your Power BI data model?
Connecting two clean files is easy. Real company data usually isn't clean. Customer IDs don't match between systems, and five spreadsheets each tell a slightly different story. Sorting that out is where most small businesses get stuck, and it's the work we do at Tapestries Group.
- Something broken right now? Our $299 Power BI fix covers one problem, and you don't pay if we can't fix it.
- Building reports for your team? See Power BI advisory for fixed-price setup, dashboards and training.
Or book a free call and tell us what you want to build.