If you need a quick way to turn a spreadsheet into reports or dashboards your team will actually use, Power BI is a good place to start. Power BI Desktop is free, it connects to Excel in a couple of clicks, and if you've ever built a PowerPoint slide you already know most of how the report canvas works.
In this guide I'll take an Excel sheet with a list of suppliers, load it into Power BI Desktop, clean it up a little and build a simple report from it.
How Power BI works: Desktop and the Power BI service
Power BI has two parts. Power BI Desktop is a free Windows app where you connect to data, clean it up and build reports. The Power BI service (app.powerbi.com) is the online side, where you publish those reports and share them with people in your organization.
The usual flow: import and transform your data in Desktop, then publish it to the service once it's ready for other people to see.
Step 1: Install Power BI Desktop
Download Power BI Desktop from the Microsoft Store or from Microsoft's download page. I'd pick the Store version because it updates itself every month. Desktop only runs on Windows, so on a Mac you'll need a Windows virtual machine.
You don't need to sign in to build reports. You will need a work or school account to publish and share them, because the Power BI service doesn't accept personal addresses like Gmail or Outlook.com.
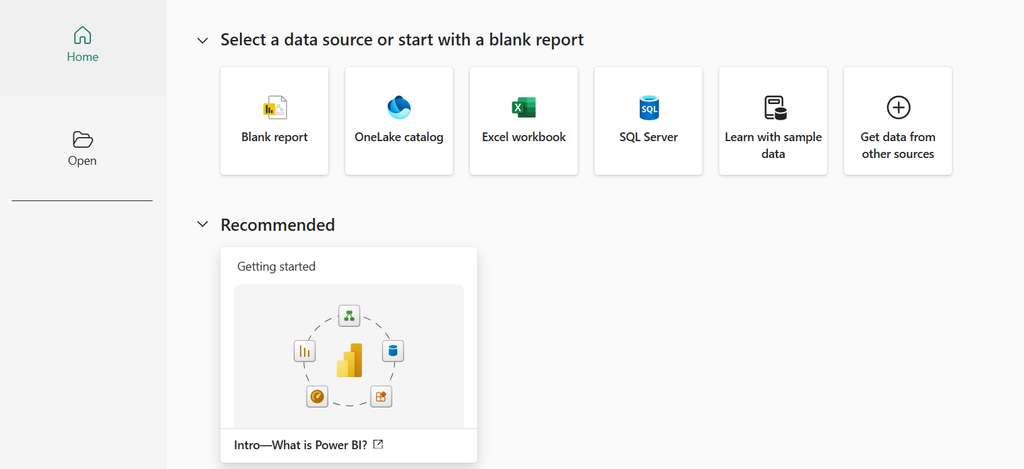
Once it's open, you'll see the home screen:
Step 2: Load your Excel data
Since I'm working from an Excel workbook, I selected "Excel workbook." After you pick the file, the Navigator opens and lists every sheet and table in the workbook. Check the box next to the one you want and click "Load."
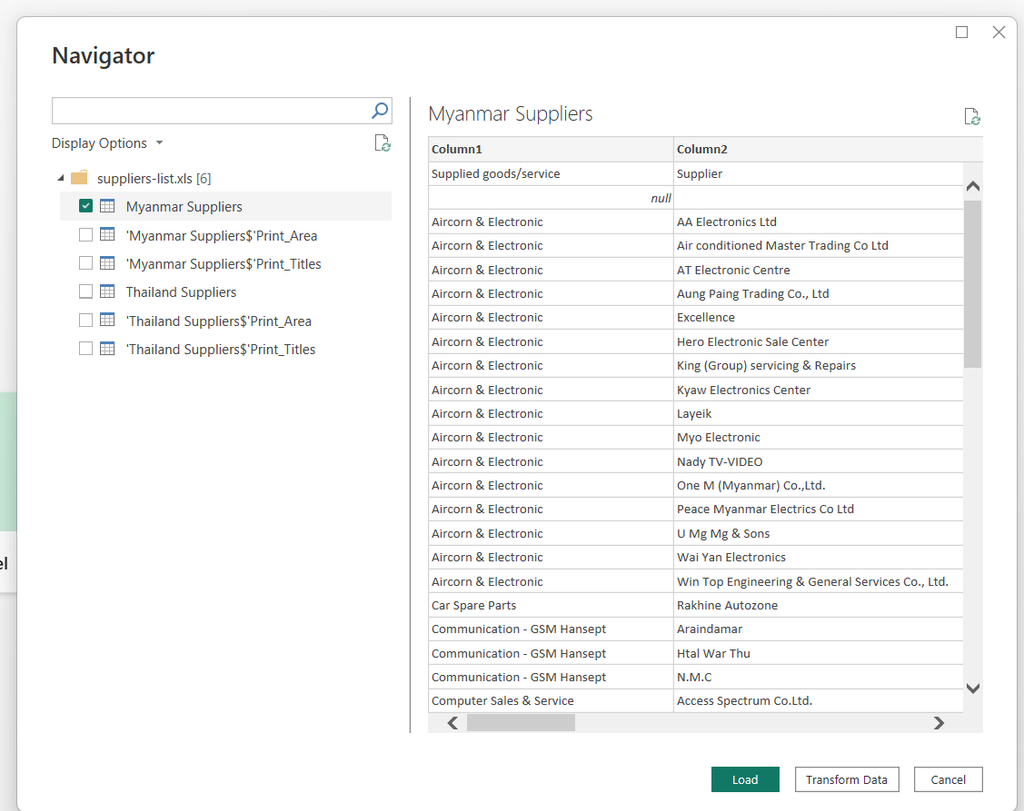
If your columns come through as Column1, Column2 and so on, like mine did, your data is sitting on a plain sheet rather than an Excel table. Either fix the headers in Power Query (next step) or go back to Excel, click inside your data, press Ctrl+T to format it as a table, and load it again.
Step 3: Clean up your data in Power Query
"Load" brings in the whole table as it is. To filter rows, rename columns or fix data types first, click "Transform data" on the Home ribbon. That opens Power Query, which saves every change as a step and repeats it each time the data refreshes.

It's worth a look even on a simple file. Two things I'd do with this one: click "Use first row as headers" so the columns get real names, and filter out blank rows. My sheet had an empty row near the top, and it shows up in the report below as a supplier with no name.
Step 4: Build your first Power BI report
Building the report was pretty easy. Power BI Desktop works a lot like PowerPoint. You pick the visual you want (a bar chart, a table, a card) from the Visualizations pane, then move and resize it anywhere on the canvas.
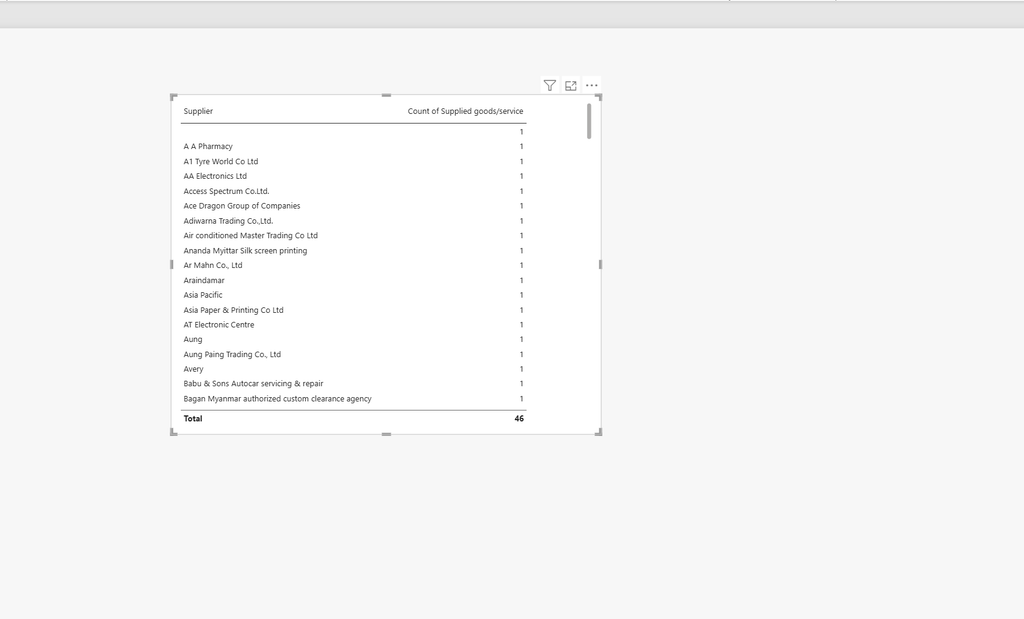
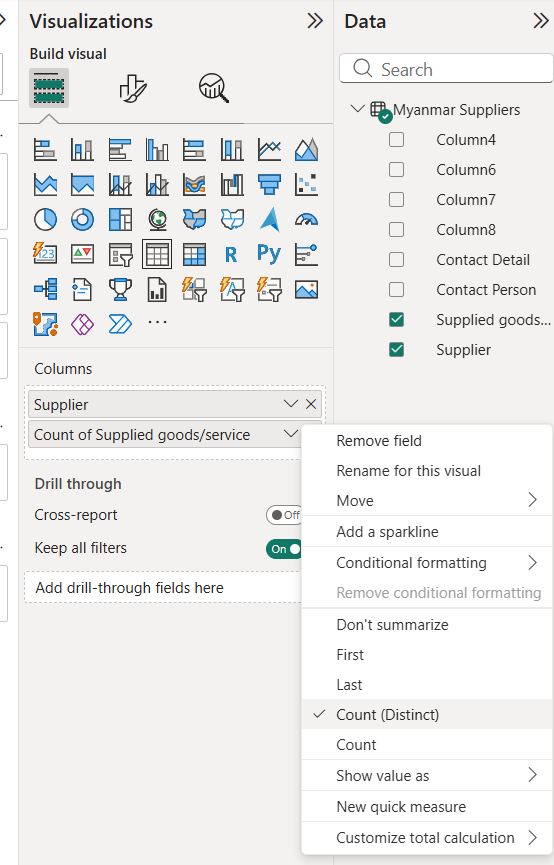
For this report I chose a table. I added the "Supplier" column, then did a distinct count on the "Supplied goods / service" column to count the types of goods and services each supplier provides. To change how a column is counted or summed, click the arrow next to it in the Visualizations pane.
One of the best things about Power BI is that visuals on the same page are connected. Add a bar chart next to the table, click a supplier in the table, and the bar chart filters to that supplier. Nobody has to set that up. It just works.
Step 5: Publish and share your report
When the report is ready, click "Publish" on the Home ribbon and choose a workspace. To share reports and data models with the rest of your team, you'll need a Power BI Pro license at $14 per user per month (Microsoft's US list price), and so will the people viewing them, unless the report sits on a Fabric capacity. Power BI Pro vs Premium Per User vs Fabric covers which one a small company should buy.
To keep the numbers current, set up a scheduled refresh in the Power BI service. If your Excel file lives on your own computer instead of OneDrive or SharePoint, refresh also needs an on-premises data gateway. When a refresh stops working, start with Power BI scheduled refresh failed: 7 causes and why your Power BI gateway keeps disconnecting.
Where to go from here
Once you're comfortable with one table from one file, the next steps are connecting more data sources, relating tables to each other and writing a few DAX measures. As your reports grow, read DirectQuery vs Import before you connect to a database, and keep why your Power BI report loads slowly handy.
Need help getting Power BI set up?
Power BI is easy to start with. Rolling it out across a company, with the right licenses, a clean data model and refreshes that don't break, is where most small businesses get stuck. That's the work we do at Tapestries Group.
- Something broken right now? Our $299 Power BI fix covers one problem, and you don't pay if we can't fix it.
- Setting Power BI up for your team? See Power BI advisory for fixed-price setup, dashboards and training.
Or book a free call and tell us what you want to build.